
Motivation and Scope
Workflow to map points of interest (POI) in OpenStreetMap (OSM) from a comma-separated values (.csv) file and generate a dynamic web map.
It is important to highlight that this procedure can be carried out by novice mappers and that it is more suitable for mapping little data, for example, schools, health posts, emergency sirens etc., confined to an area that could be, for example, downloaded with iD or JOSM.
To import a larger volume of data into OSM, you need to be an experienced mapper (intermediate or advanced level), to document the procedure on the OSM Wiki and to obtain community approval. This case is not the focus of this tutorial.
Materials
For this activity, you will need:
- Data file in .csv (see example files after this list);
- Spreadsheet program, some suggestions are: OpenOffice Calc, LibreOffice Calc ou Gnumeric;
- Geographic information system QGIS with the plugin MMQGIS installed and active;
- Internet browser with JavaScript permission;
- iD Editor, the default editor of OSM;
- uMap;
Example files — To carry out this practice, two .csv files are available, with the geolocation and other atributes of emergency sirens installed in the City of Maricá (Rio de Janeiro, Brazil) — the hydrological warning and alarm stations - EAAH and the geological warning and alarm stations - EAAG). Data is in the public domain and was donated by the Civil Defense Secretariat of the Municipality of Maricá.
It is always necessary to know the license of the original data in order to check its compatibility with the OSM ODbL license.
Workflow
A - Getting and preparing data (initial file)
Obtain data from official sources (by download from institutional websites or through personal communication with the public administration). Check whether the data license is compatible with the ODbL license (as explained above).
Open the .csv file in the spreadsheet program and prepare the file, following the recommendations below, before starting geoprocessing:
- Ideally, the .csv file has to include the latitude and longitude data. However, if the file does not includes coordinates, it must contain the addresses or any free geocode, so that the geolocation of the objects of interest is possible (in the case of example, the geographic coordinates of emergency sirens).
Note: preparation of the .csv file, only in case it does not include the coordinates. If your file has them, go to the next point.
Perform geocoding of addresses with the MMQGIS plugin, after adding the .csv file as a vector layer in QGIS; or use other means for geocoding in order to generate the two coordinate value fields - latitude and longitude. Sometimes, the geocoder does not find some addresses, but a file is available, which can be used to search for the coordinates and enter them manually in the same .csv.
-
The decimal separator of the coordinates must be the point (“.”) and not the comma (“,”) to be read by the MMQGIS plugin. Make adjustments to the data, if necessary. For example: -23,102378 changes to -23.102378.
-
Check the accentuation of words and any other important aspect so that the data is as correct as possible. When opening the file, if the accents and other special characters were not recognized, check if the data is encoded in UTF-8 or ISO-8859-1, which are the charsets used in Brazil (if the reader is from another country, check the charset suitable for your region). This is checked in the spreadsheet program itself.
-
The file must also contain an “id” field, which will be used to generate the points, as described in step B. If there is not an identifier field, includes another column and name as “id”. Assign integer values (1, 2, 3…) in all lines that contain data.
B - Generating points
The records have geographic coordinate attributes (latitude, longitude), but they still need to be transformed into points (spatial objects). This step is carried out like this:
- Open the .csv file in QGIS and check if the project is in the WGS-84 geodetic reference system (EPSG: 4326), as it is the system used in OSM. This is accomplished by following the menu path:
Project –> Properties
- Generate the points that correspond to the coordinates, following the menu path:
MMQGIS –> Import/Export –> Geometry Import from CSV file
choosing the format .geojson for the output file.
C - Preparing file for the automatic tag recognition
To facilitate the mapping of points in OSM, it is important to ensure the semantic compatibility of the data attributes names with the tags adopted in OSM, so that they are automatically recognized. See an example in the following figure:
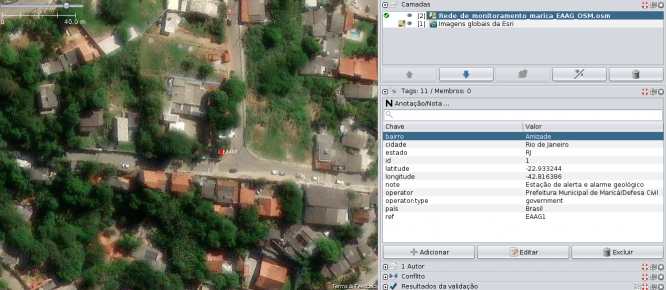
Perform this adjustment by modifying the data attributes in the .geojson file directly in a notepad or word processor, changing the attributes names with the “find and replace” function, being careful to don’t delete the quotation marks, as they are necessary for the integrity of the .geojson.
Exemple of some data attributes names (.geojson of emergency sirens data) and the corresponding OSM tags:
attribute’s name in .geojson —- Corresponding OSM tag
nome —- ref (ex: EAAH1, EAAG6,…)
responsavel —- operator
bairro —- addr:suburb
cidade —- addr:city
país —- addr:country
latitude —- lat (ou latitude)
longitude —- lon (ou longitude)
Important notes:
The .csv file for the example of the emergency sirens also contains two attributes - “tipo” (type) and “rede” (network), for which there are no corresponding OSM tags. But these attributes (type and network) can be unified into a single attribute, named “note”, to enter as a data note tag, or they can be deleted.
It is important to create another attribute called “emergency” and to include the “siren” values in all lines of the file. And also to delete the “id” field that was created to generate the points, in a previous step of this tutorial. These two actions can be performed in QGIS.
D - Loading the points file in the iD editor and mapping in OSM
At https://osm.org, search for the area of interest (area of location of points, in our example of the emergency sirens), zoom in and click on “Edit” button choosing the iD editor;
If necessary, align the background image following:
Background image –> Image shift control
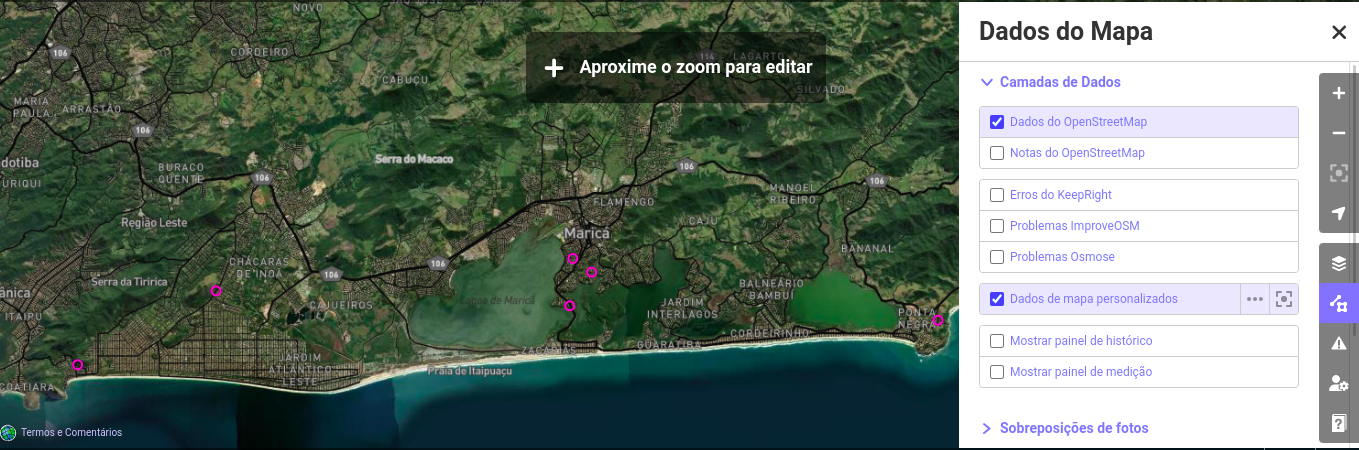
Load the .geojson file (in the example, the siren points) by clicking the Map Data control on the right menu:
Map data –> Custom map data –> click on the three dots and load the .geojson file
Note: iD accepts the loading of vector files in other formats, such as .gpx, .kml and .json, or even Web Map Tile Service addresses (WTMS).
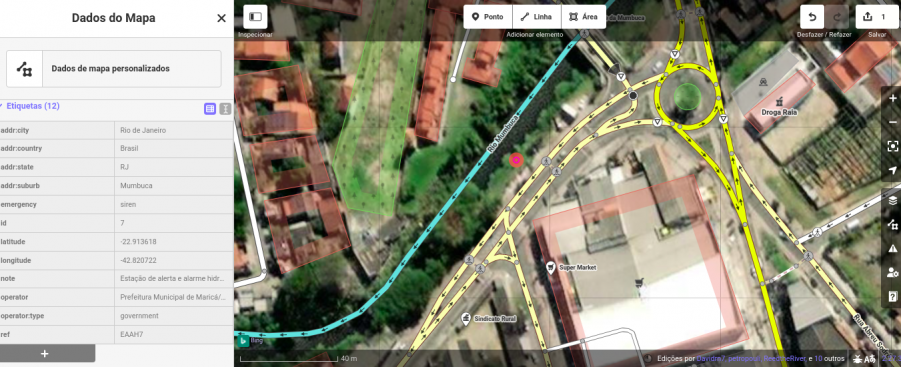
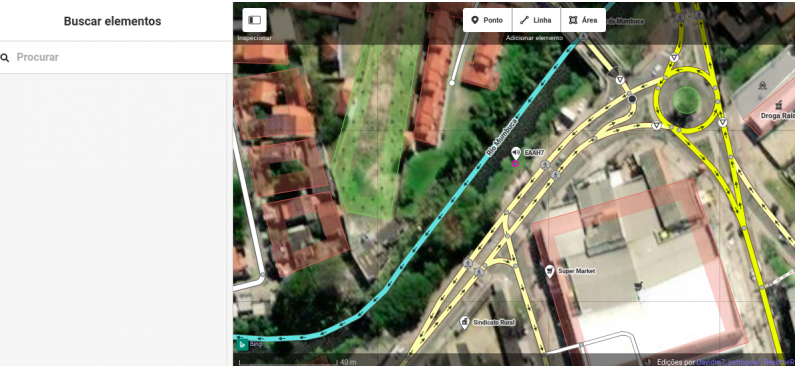
After loading the .geojson file into iD, the points are shown in a highlight color (in the example, pink):
Here, an approximation for one of the points:
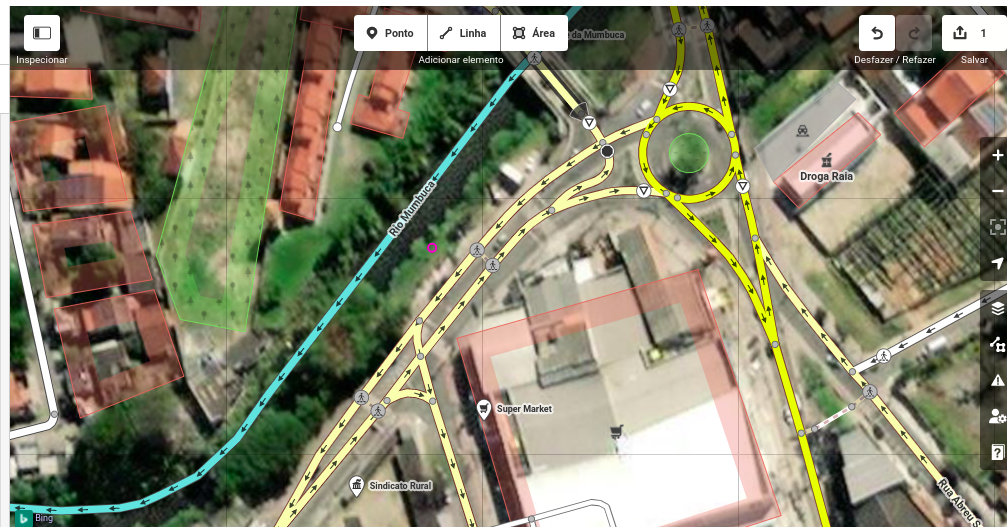
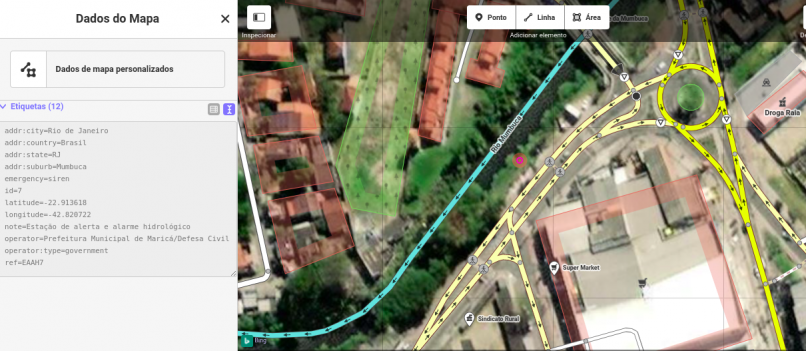
By clicking on the highlighted point, the tags are automatically recognized and displayed, as they are semantically compatible with the OSM data model:
However, these points are not yet OSM objects, they are just another data layer in iD editor.
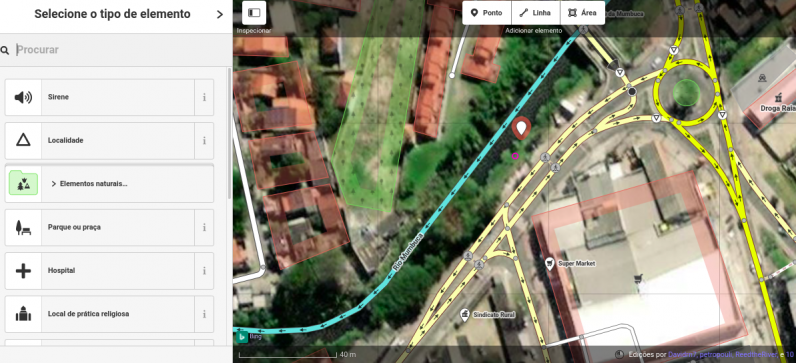
To resolve this, map the points, one by one, checking whether they already exist in the OSM cartographic base. For each point, copy the group of labels from the colored points and paste them into the new point that was mapped.
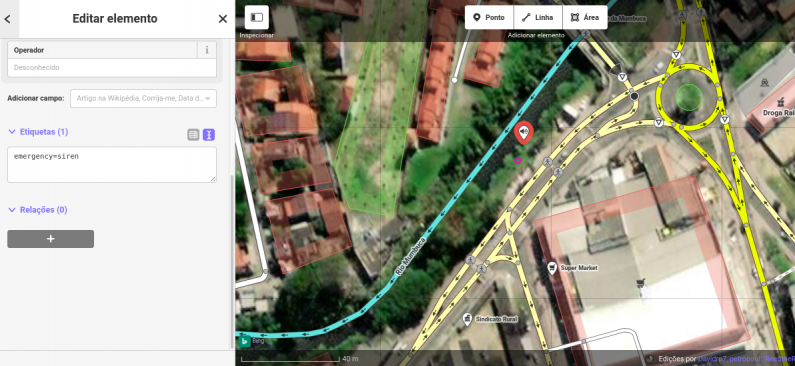
After pasting the tags, the point shows the value of the “ref” on the icon (in the example of sirens), signaling that the point and the tags are already OSM objects:
IN THE CASE OF THE EXAMPLE (SIRENS), DO NOT UPLOAD IT TO OSM, AS IT IS ALREADY MAPPED IN THE BASE!
But, if you are processing your own data, you can upload the data to OSM (using the iD editor) and don’t forget to inform the source and to include detailed comments that can help future mappings.
Some important notes about the changeset comments:
-
Remember that to comment changesets only with hashtags is not a good practice, offer details about the data uploaded to OSM;
-
Note that there is a time limit for a changeset to remain open for editing, which means that you must upload the data within 1h. If there are many points, one solution is to upload more than once, sending the changes little by little and continuing to edit;
-
Do not include sensitive data of individuals and enterprises in OSM;
Note: if the reader is an experienced mapper, this step can be performed by replacing the use of the iD editor with the JOSM editor and loading the points, using the [data conflation] procedure (osm.wiki/wiki/JOSM/Plugins/Conflation).
Creating a custom data visualization with uMap!
Using the iD editor, after uploading the data to OSM, normally, within a few minutes, the data can already be viewed in the main OSM renderer at https://osm.org.
— Attention: PLEASE, DO NOT UPLOAD THE EXAMPLE DATA TO OSM AS IT IS ALREADY MAPPED —
If you want to create a personalized visualization of the data - modifying icons and colors, grouping markers, generating hot spots etc… and in a way that your web map is accessible to everyone in the Internet, an open and dynamic map can be created in uMap, with the same OSM user account.
When you create a new web map using uMap, it will remain in draft mode until it is shared publicly by you. Until then, it is possible to work on the map and the changes will not be visible to the visitor.
To add dynamic layers – layers that automatically search and load features on the map, each time the user visits the platform — follow this step-by-step guide:
-
Log in to uMap with your OSM user account and create a new web map;
-
Create a new layer by clicking on the uMap layer control (in editing mode), following the path:
Add layer –> Remote data (at the end of the block)
- Complete the following (specific to the emergency sirens example):
URL
1https://overpass-api.de/api/interpreter?data=[out:json][timeout:25];(node["emergency"="siren"]({south},{west},{north},{east}););out body;>;out center skel qt;
Format: osm
Check the “Dynamic” option to this layer
- Choose the appearance of the labels and icons in the layer controls. The uMap Wiki page offers a guide in three languages - English, French and Italian, which can be consulted for this step.
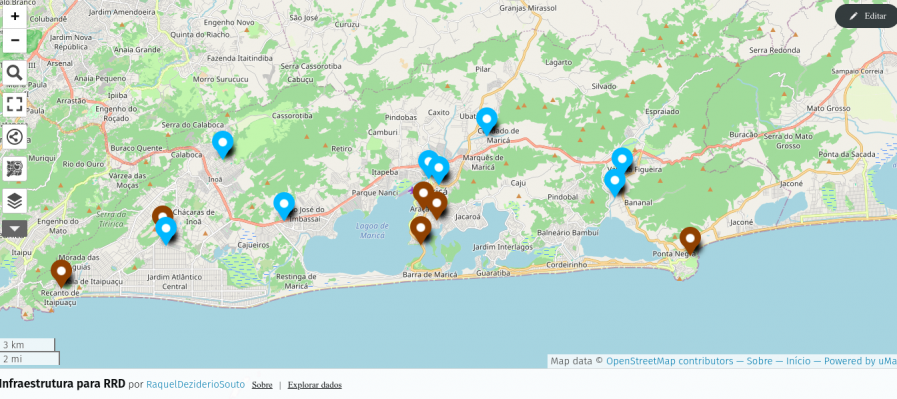
Congratulations!
If you did this practice until the end, it means that you have an uMap similar to this:
In my next blog, I will show how to create a dynamic map with the Leaflet Map plugin for Wordpress.
This content is licensed by CC BY-SA 4.0 International. You can use and adapt this content, if cite the author and keep the same license in the derivative contents.